Authors: Hang Yuan & Rosemary Walmsley & Shing Chan
Keywords: Human activity recognition, IMU, wearables, machine learning
HAR intro
Human activity recognition (HAR) is a popular application for wearable devices. HAR describes the techniques that classify human activities from time series. In HAR applications, we often use data from several modalities, such as images and accelerometers/Inertial measurement units (IMUs). This post will focus on the issues related to the most common data modality, the IMUs.
There are many examples of HAR applications in our daily lives: fitness and sleep quality tracking in smartwatches, human-computer interaction support in VR devices, and patient monitoring in clinical applications. On the surface, we might have the false perception that activity recognition from IMUs is already perfect and that nothing further needs to be done. Contrary to popular belief, among those who stopped using their wearable devices: 36% cited the perceived measurement in accuracy and 34% cited the incorrect activity tracking (Attig, C., & Franke, T. 2020). In fact, we’d argue that HAR is far from being solved because of the following reasons:
I. Difficult to define what is an activity
II. Heterogeneous benchmark baselines
III. Getting ground-truth data for HAR is both expensive and difficult
IV. Diverse characteristics lead to different activity profiles
V. Lacking standardisation in data storage, processing and analytics
I. Hard to define what is an activity
For us humans, it is obvious when someone is running or doing dishes. However, it is much harder for machines to know what constitutes an activity. Take walking, an apparently simple behaviour, as an example. Despite its perceived simplicity, designing a step counter is non-trivial.
Below you can find three different gait patterns:
| Regular walk | Irregular walk | Edler Strolling |
|---|---|---|
 |
 |
 |
Figure 1: Walking patterns. Source: GIPHY
Depending on someone’s age and context, even a simple action like gait can come in many shapes. A young adult might have a regular gait cycle. However, an elder might have a gait pattern that’s anything but regular. The duration, trajectory, and morphology of even the same activity type can be vastly different.
Maybe it is hard to define exactly what is a gait. One might be tempted to define many gait subtypes to account for the differences in how people walk in different contexts. What a brilliant idea! The Compendium of Physical Activities (Ainsworth, et al., 2000) is one of the major initiatives that aim to have a universal activity taxonomy. The compendium is widely used in epidemiological studies. More recently, ego4d (Grauman, et al., 2022) also proposed something similar by having over 200+ activity labels to apply to its ego-centric video stream for VR. Depending on the application, we might choose a different activity dictionary.
Nonetheless, it is important to note that none of the activity compendiums is perfect. In an ideal world, all we need is a single model that can classify every possible activity type. Unfortunately, we won’t be able to do that mainly because we will need a lot of data with annotated human activity. Right now, even the largest HAR dataset that we are aware of is too small to develop a model like that. More often, it suffices to develop a classifier using a much simpler definition. For example, if we only want a rough idea of how active someone is in general, we might be happy with a classifier that can separate sleep, sedentary behaviour, light physical activity, and moderate-to-vigorous physical activity like Walmsley, et al., 2022.
Another reason why HAR can be challenging is that we need an evolving activity definition to account for everything that we want to capture. As new hardware surfaces, we need to have novel gesture recognition to improve the human-computer interaction (HCI) process. For example, Apple Watch’s battery doesn’t last very long, so the Watch tries to preserve the battery by keeping the screen dim until a specific uplift motion is detected. The lift detector is designed to capture when the user looks at the watch. This motion is unique and specific to the type of device. A general HAR model won’t be able to capture this type of motion, hence, adding more complexity to the HAR model development.
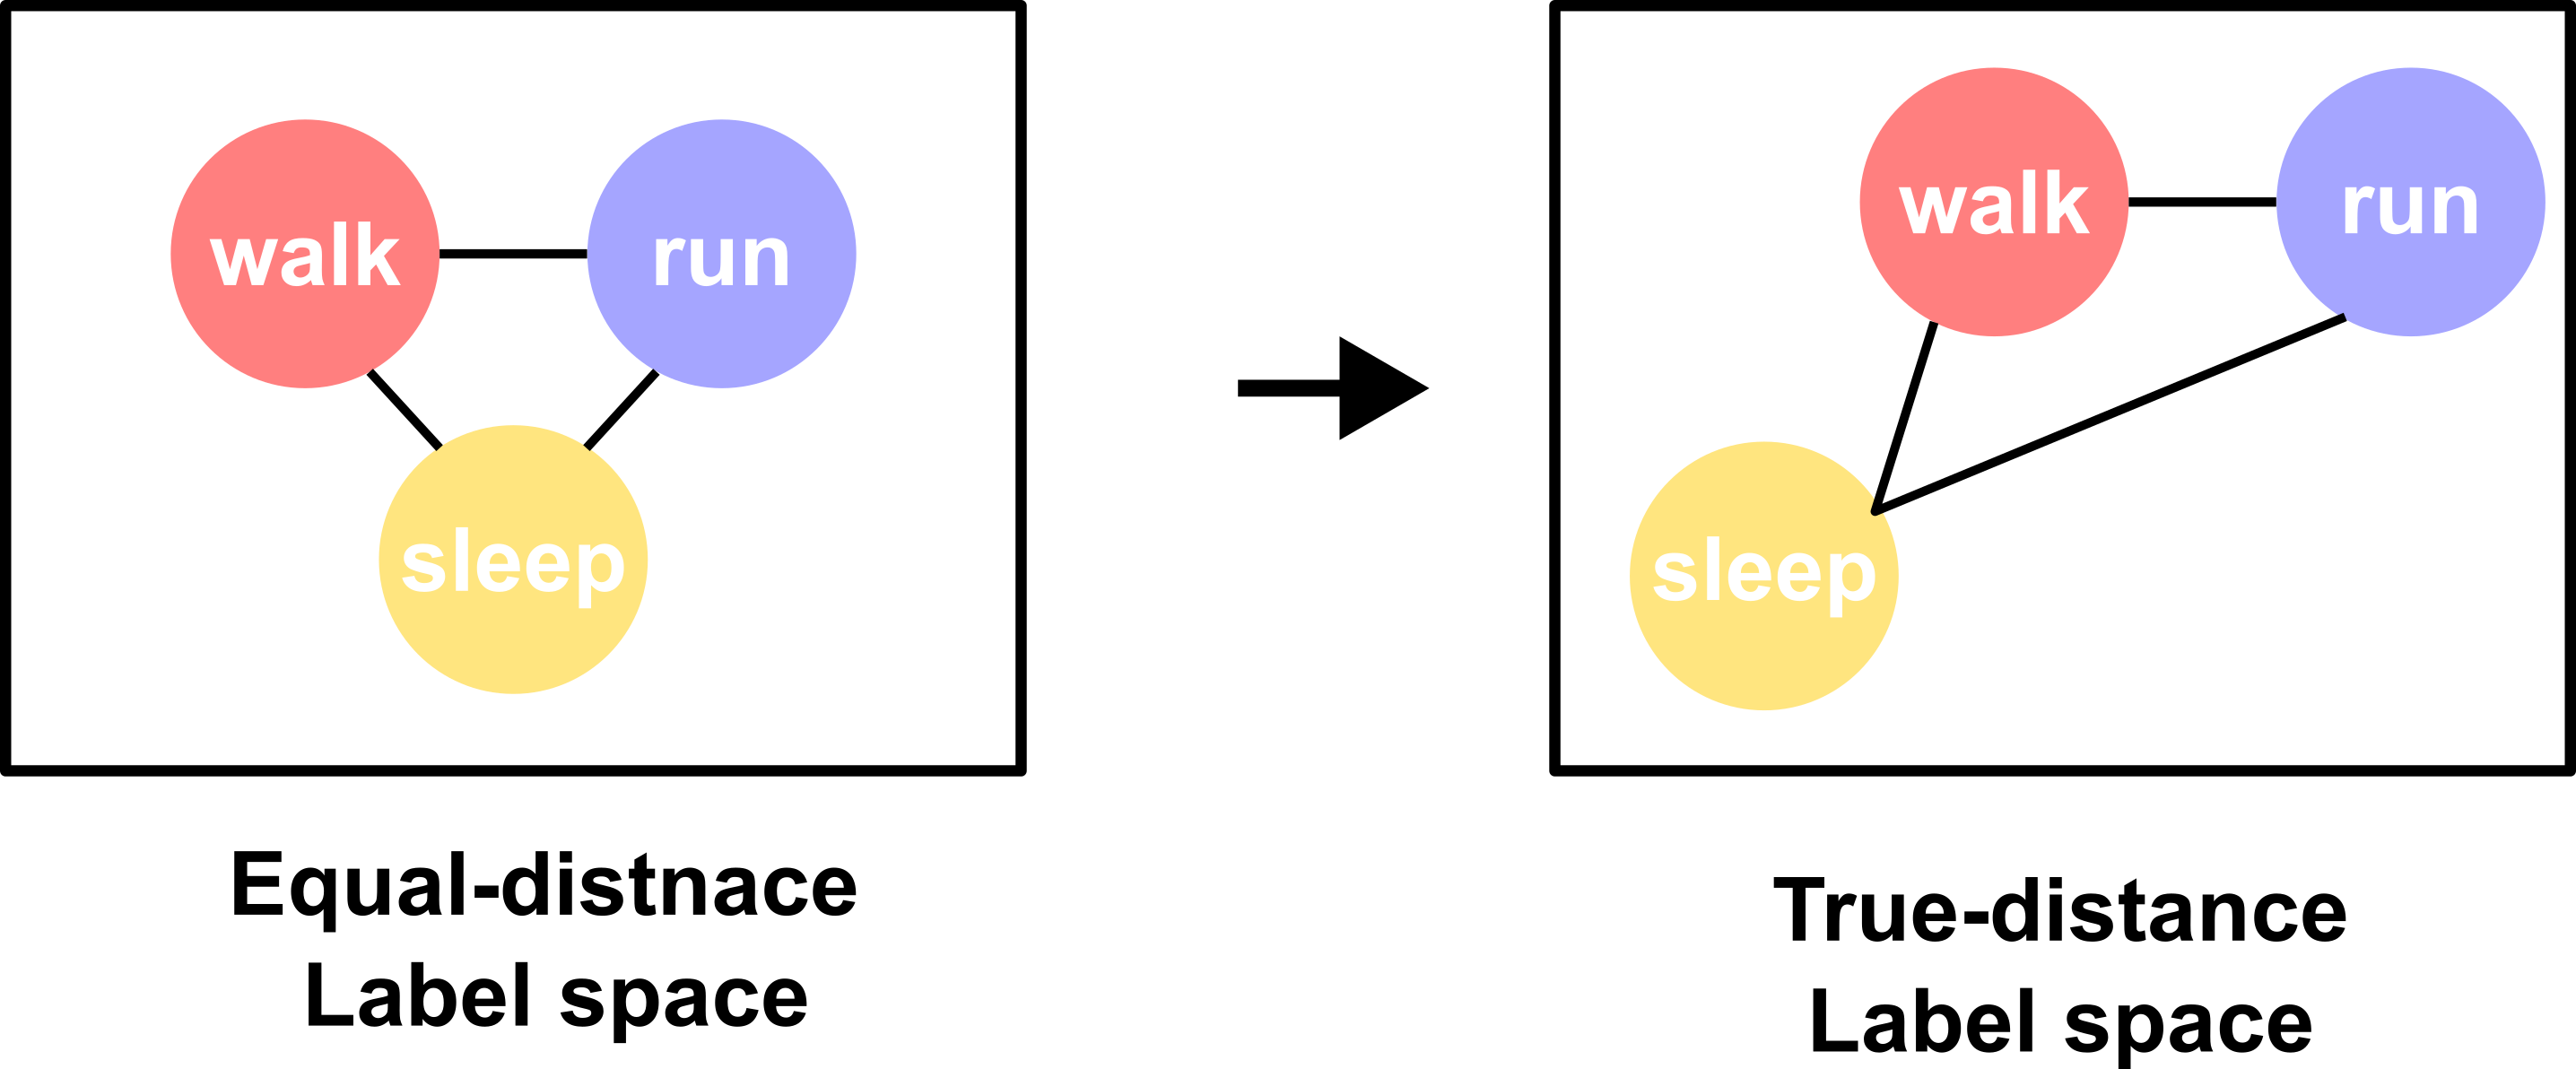
Finally, something might be fundamentally wrong with how we treat an activity class. The current state-of-the-art HAR models often assign one activity class to a fixed-length window, e.g. 10 seconds. In a three-class classification where we try to discriminate between walk, run and sleep, the model receives the same penalty in training regardless of whether the model misclassifies walk as sleep or run. The main reason for the undifferentiated penalty is that the model assumes that all the classes have an equal distance in the label space (Figure 2 left). The commonly used one-hot encoding label format exemplifies the equal-distance assumption. To mimic the true-distance label distribution (Figure 2 right), the model should receive a greater penalty if a walk sample is mistaken as sleep than run. Many studies have tried to convert the discrete input format into a continuous representation that reflects the data similarities as seen in language learning like word2vector. However, much less work has been done in the representation learning of the label space for HAR. To help resolve this issue, when annotating the data, we shouldn’t only just assign a window with one label. For ambiguous cases especially, we might benefit from noting down all the possible labels for a window. Then, we could employ techniques such as soft label learning to enhance our model performance.
II. Heterogeneous benchmark baselines
The benchmark datasets for HAR are so heterogeneous that as a field, we don’t know how to make an apple-to-apple comparison for different modelling techniques. In popular machine learning conferences nowadays, there is a big emphasis on beating the state-of-the-art performance on existing benchmarks. In the field of computer vision, for example, one can evaluate a new method on ImageNet or COCO; if a paper proposes an algorithm that beats the current best model on these benchmark datasets, then that paper becomes the new state-of-the-art. How much a contribution a paper largely depends on the performance difference between the proposed algorithm and the existing best method. When a well-recognized benchmark exists, it is easy to make an apple-to-apple comparison between different methods. However, in HAR, we don’t have a well-recognized benchmark yet, which makes it much harder to identify the method with the best performance.
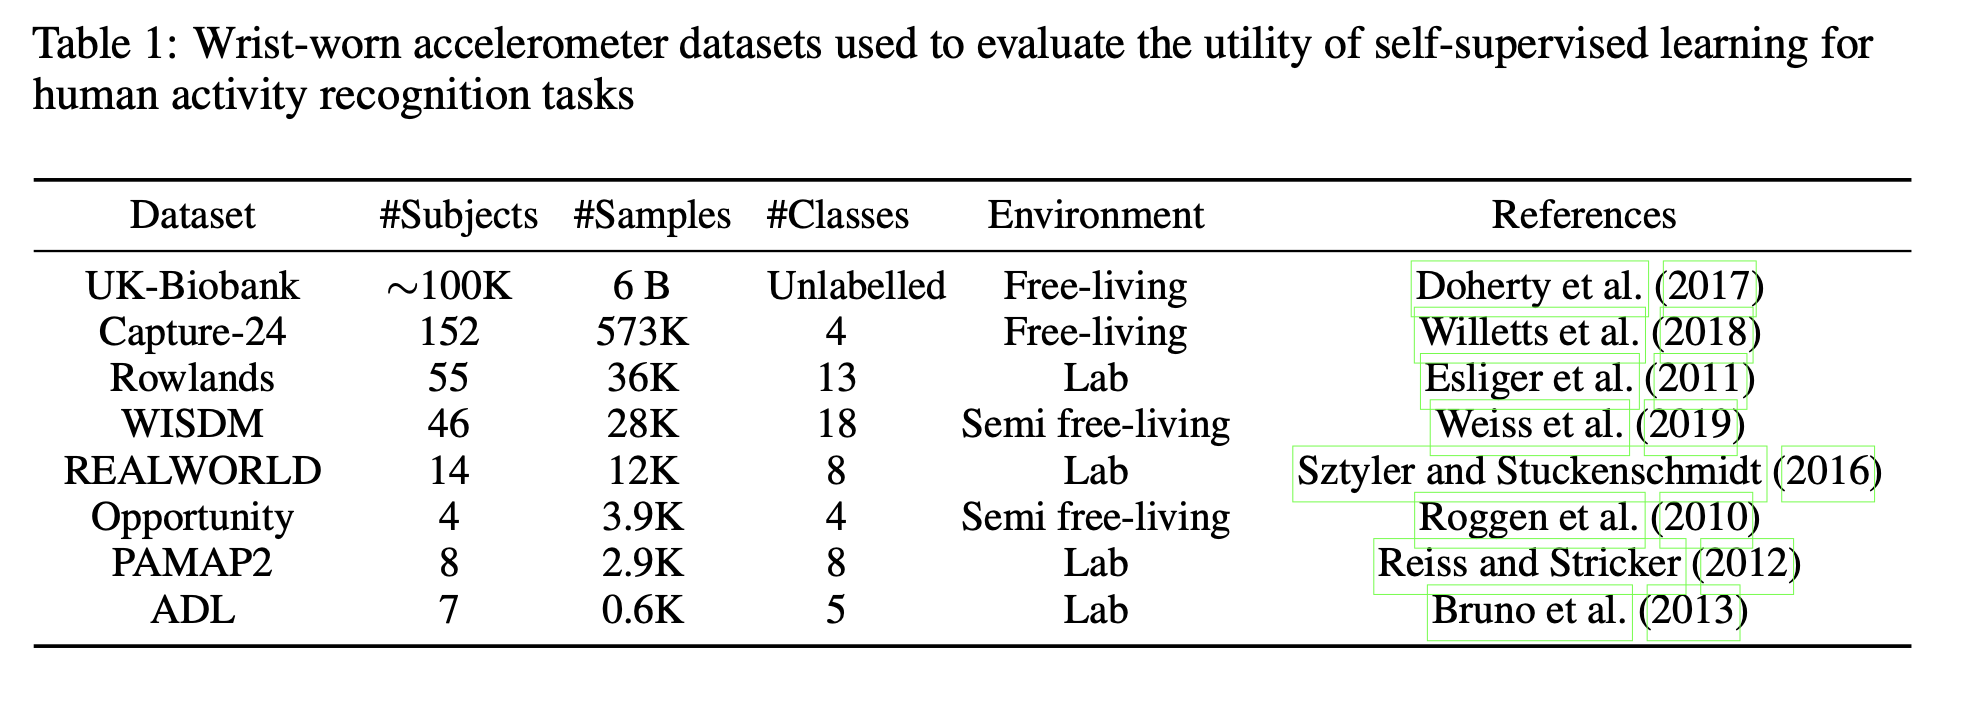
There have been many open-source HAR benchmarks for researchers to use (Table 1). However, no existing dataset has become the gold standard for comparing different algorithms. The reasons are multi-faceted:
- Most of the benchmarks are small. For small datasets, cross-validation is better suited to provide a more robust estimation of the empirical risk as compared to the larger datasets. For evaluation on a larger dataset, usually, a subset is held out as the test set instead. Having a common test set makes it easy to compare different methods. In most HAR research, however, people rely on their own way of data partitioning, making it impossible to compare results from different papers directly.
- The limited sizes of the benchmarks also mean that the number of activity classes labelled is also limited. Often, we will see almost perfect performance on some of the smaller datasets, but that doesn’t mean the method used is perfect for HAR. Especially, for small lab-based benchmarks, only a few activity classes are included, thus it is easier to obtain a great performance.
- We define an activity label over a fixed window length. However, the current benchmarks have vastly different window length definitions in their evaluation, making it hard to even compare the model performance across different datasets.
- Lastly, data collected in a lab environment doesn’t truly reflect the model performance in the real world. Admittedly, it is much easier to set up some mounted cameras in a lab so that we can label the data by looking at the video stream. However, people will likely behave differently in a lab and free-living environment. So to fully appreciate the performance of HAR, we need to test our model on more datasets collected under free-living conditions.
| Dataset | #Samples | Evaluation method | Window length | Evaluation metric |
|---|---|---|---|---|
| Capture24 | 910K | Held-one-subject_out | 30 sec | F-measure/Kappa |
| Rowlands | 36K | Tested proprietary algorithms with all subjects being in one test set. | 1 min | ROC |
| WISDM | 28K | 10-fold CV | 5 sec/10 sec | Accuracy |
| REALWORLD | 12K | 10-Fold CV | 1 sec | F-measure |
| Opportunity | 3.9K | Fixed train/test split | 500 ms | F-measure/AUC |
| PAMAP2 | 2.9K | 9-fold CV | 5.12 sec | F-score/Accuracy |
| ADL | .6k | None specified | No fixed window length | Accuracy |
As for the data-sampling variations shown above, from experience, it doesn’t make a big difference for analysis with deep learning models. 30 Hz is usually a good threshold between battery consumption without the loss of performance for IMUs. Since most of the frequency content in human motion falls below 15 Hz (send us a reference if you have one!), going below 30 Hz will risk losing information useful for classification as suggested by Small, et al., 2021.
III. Getting ground-truth data for HAR is both expensive and difficult
One of the key reasons why existing benchmark datasets is small is that it is challenging to annotate ground truth for IMUs. To annotate HAR datasets, we will require concurrent ACC and video data. The difficulties are:
- We sync the timestamps on both the wearable and video recording devices, for which the timestamps might not be in perfect synchrony.
- It might be easy to obtain a video stream of human activity in a lab environment. However, data collected in a lab doesn’t reflect the data distribution in a free-living environment. However, getting the concurrent video stream in a free-living environment is much harder because we would require the participants to wear an ego-centric camera or install many cameras in the participants’ living environments. Neither of these is ideal, and both cause privacy concerns.
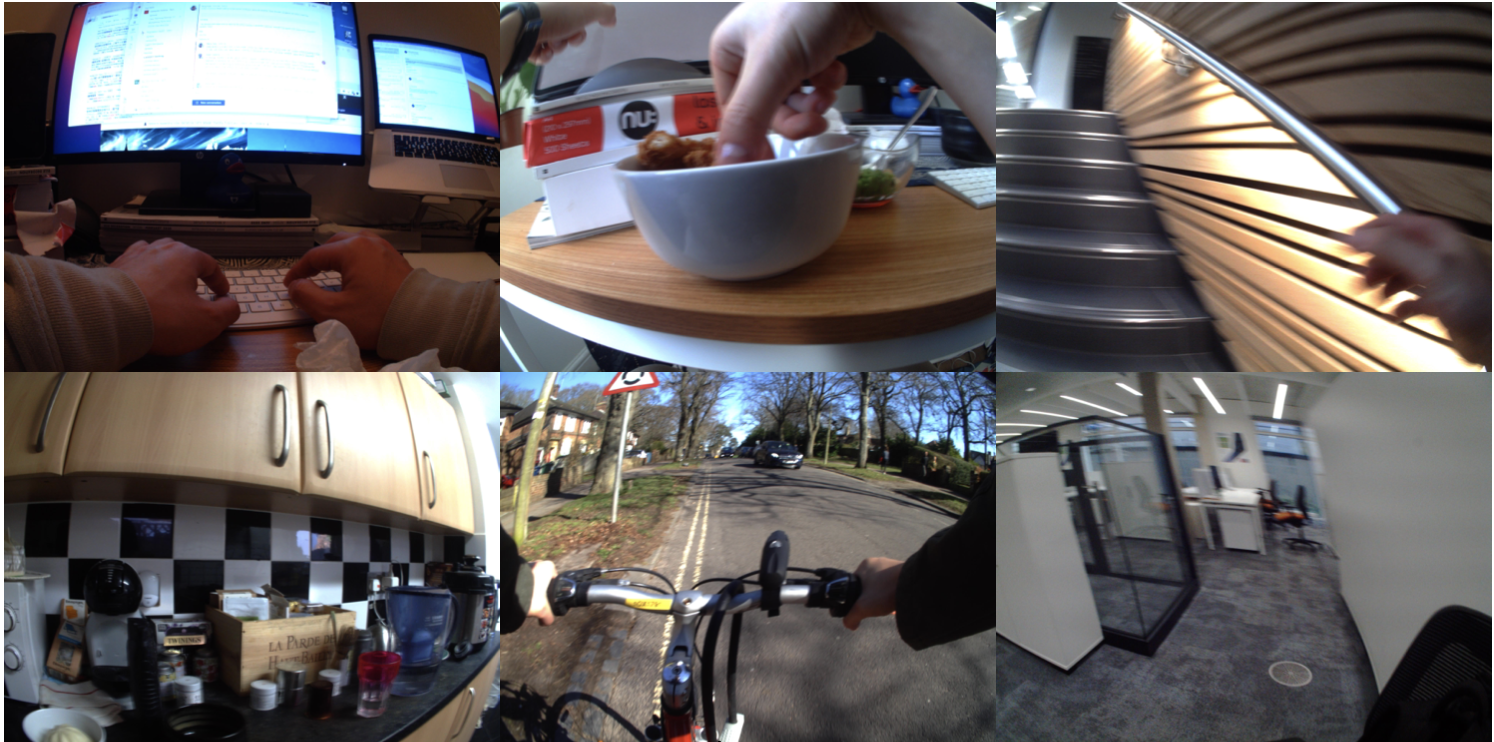
Impossible to annotate the video at a high frame rate
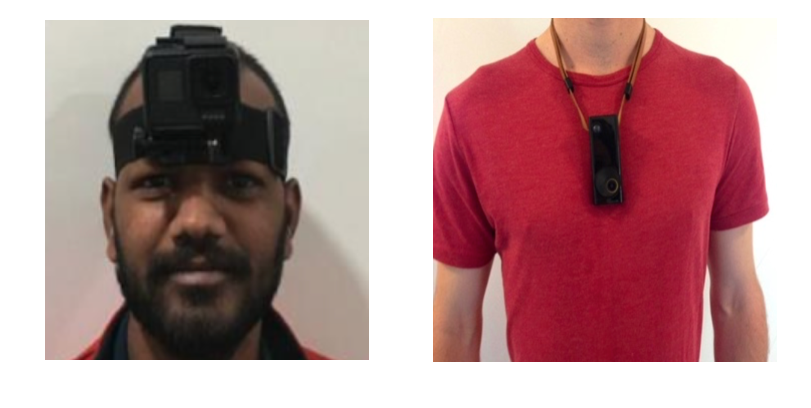
Below is a list of images taken when I wore an ego-centric camera. An annotator would need to select an activity from 200+ activity classes for every picture taken. Depending on how many pictures are taken per second, the sheer volume of the task becomes extremely large. If one image is taken per second, then one will need to annotate 1 * 60 * 60 * 24 = 86400 images just for one day of data per person. We are no way near to having the capacity to have high-quality free-living data at the moment. The best dataset that we are aware of at the moment is the capture-24 which only takes one image every 30 seconds. On the other extreme, we have ego4d, which has a very high frame rate but a much shorter duration.
Capture-24 and ego4d used different approaches to annotate human activity. The key difference between Capture-24 and ego4d lies in the sampling rate of the camera footage. Exactly how much signal is lost when doing the annotation with a lower sampling rate high depends on the sort of behaviour that we try to capture. We could also argue that activity variations over too short a time, for example, <1s or <5s, just shouldn’t represent a separate behaviour because humans don’t really shift behaviour that quickly. How quickly behaviour changes is also population specific. Activity transitions are likely to happen more quickly for kids than adults.
IV. Diverse characteristics lead to different activity profiles
For the same type of activity, we shall expect to see large variations across populations. These activity variations are problematic because the model trained on a young healthy population is going to perform worse on an older population for example.
Many aspects contribute to the variations we see in different population profiles:
- Age
- Weight
- Height
- Arm length
- Occupation
- Education
- Income level
- Nationality
The easiest solution is to collect more data, which we sadly don’t have most of the time, especially for labelled data. The alternative is to use methods that can make use of unlabelled data, which is much easier to get hold of. Relevant works include using transfer learning to personalise the prediction trained on a large pool of subjects to a specific subject for which we have very limited data. Self-supervised-learning can also be used to learn useful embedding from unlabelled data such that the eventual model only needs to be fine-tuned on a much smaller labelled dataset. (Tang et al., 2021, Haresamudram et al., 2022, Yuan et al., 2022).
V. Lacking standardisation in data storage, processing and analytics
Last but not least, HAR is hard not just because solving the problem itself is hard but also because wearable tech is still in an early stage so there is a lack of standardisation in data storage, processing and analytics. For the research-grade and consumer-grade smartwatches, because of the lack of standardisation, each vendor is using its own bespoke data storage format best suited for its own device. There are times when diversity is good, but different data formats bring even more differences in data processing and analytics pipelines. Even though they might try to capture the same data modality, we are still entirely sure whether the data collected and processed by different devices are comparable. Therefore, many validation studies have been done just to know how to explain the device difference and how the device differences might contribute to contradicting conclusions in research studies (Tully et al., 2014, Miller et al., 2022).
Understandably, it might not be easy to make a standardised format for everyone because each device manufacturer might have different data format requirements. However, we will save a lot by introducing these standards as a field. Having a universal standard would require buy-in from all state-holders, commercial companies, research labs and end-users to agree and design the best all-purpose future-proof solutions that everyone can benefit from. Although some effort has been made in the industry, such as the project Aria developed by Meta, the field has not picked up momentum just yet.
Conclusion
In summary, the wearables field is rapidly growing, as exemplified by the recent launch of the Apple Watch ultra, which even incorporates a temperature sensor into its design. Maybe more data modality will enhance the applicability of wearables for HAR in the future. With the additional data modality, we can better capture the activities where movement is not the best indicator of activity intensity. For example, when using IMUs to classify weight lifting or construction work, the wrist movement will be slow, without concurrent physiological data, it will be hard to separate strenuous work from other light activities.
There is still a lot of work to be done around the hardware before we can move towards a more unifying data storage and analytics standardisation. Equally importantly, we need to develop novel methods to understand the buried information and then potentially translate the information into more actionable insights.
References
[1] Ainsworth, B. E., Haskell, W. L., Whitt, M. C., Irwin, M. L., Swartz, A. M., Strath, S. J., … & Leon, A. S. (2000). Compendium of physical activities: an update of activity codes and MET intensities. Medicine and science in sports and exercise, 32(9; SUPP/1), S498-S504.
[2] Grauman, K., Westbury, A., Byrne, E., Chavis, Z., Furnari, A., Girdhar, R., … & Malik, J. (2022). Ego4d: Around the world in 3,000 hours of egocentric video. In Proceedings of the IEEE/CVF Conference on Computer Vision and Pattern Recognition (pp. 18995-19012).
[3] Yuan, H., Chan, S., Creagh, A. P., Tong, C., Clifton, D. A., & Doherty, A. (2022). Self-supervised Learning for Human Activity Recognition Using 700,000 Person-days of Wearable Data. arXiv preprint arXiv:2206.02909.
[4]Walmsley, R., Chan, S., Smith-Byrne, K., Ramakrishnan, R., Woodward, M., Rahimi, K., … & Doherty, A. (2022). Reallocation of time between device-measured movement behaviours and risk of incident cardiovascular disease. British journal of sports medicine, 56(18), 1008-1017.
[5] Small, S., Khalid, S., Dhiman, P., Chan, S., Jackson, D., Doherty, A., & Price, A. (2021). Impact of reduced sampling rate on accelerometer-based physical activity monitoring and machine learning activity classification. Journal for the Measurement of Physical Behaviour, 4(4), 298-310. Chicago
[6] Tang, C. I., Perez-Pozuelo, I., Spathis, D., Brage, S., Wareham, N., & Mascolo, C. (2021). Selfhar: Improving human activity recognition through self-training with unlabeled data. arXiv preprint arXiv:2102.06073.
[7] Haresamudram, H., Essa, I., & Plötz, T. (2022). Assessing the State of Self-Supervised Human Activity Recognition using Wearables. arXiv preprint arXiv:2202.12938.
[8] Miller, D. J., Sargent, C., & Roach, G. D. (2022). A Validation of Six Wearable Devices for Estimating Sleep, Heart Rate and Heart Rate Variability in Healthy Adults Sensors, 22(16), 6317. Chicago
[9] Tully, M. A., McBride, C., Heron, L., & Hunter, R. F. (2014). The validation of Fitbit Zip™ physical activity monitor as a measure of free-living physical activity BMC research notes, 7(1), 1-5.
[10] Attig, C., & Franke, T. (2020). Abandonment of personal quantification: A review and empirical study investigating reasons for wearable activity tracking attrition Computers in Human Behavior, 102, 223-237. Chicago
[11] Collins, K. M., Bhatt, U., & Weller, A. (2022, October). Eliciting and learning with soft labels from every annotator. In Proceedings of the AAAI Conference on Human Computation and Crowdsourcing (Vol. 10, No. 1, pp. 40-52).